
Unlock Insights with Microsoft Excel: Understanding and Utilizing the 'Analyze Data' Functionality
Unlock Insights with Microsoft Excel: Understanding and Utilizing the ‘Analyze Data’ Functionality
Quick Links
One of the most common tasks people perform aside from adding data to a spreadsheet is analyzing it. But did you know that Microsoft Excel has a built-in feature specifically for this? It’s called Analyze Data, and it can help you see trends, patterns, rankings, and more.
Analyze Data was renamed from a previous feature called Ideas. It’s available to Microsoft 365 subscribers on Windows, Mac, and the web.
Open Analyze Data in Excel
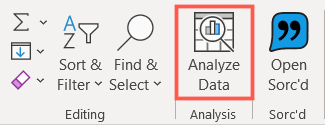
Assuming that you have some data prepared that you’d like to analyze, you can open the tool quite easily. Select a spreadsheet, head to the Home tab, and click “Analyze Data” toward the right side of the ribbon.
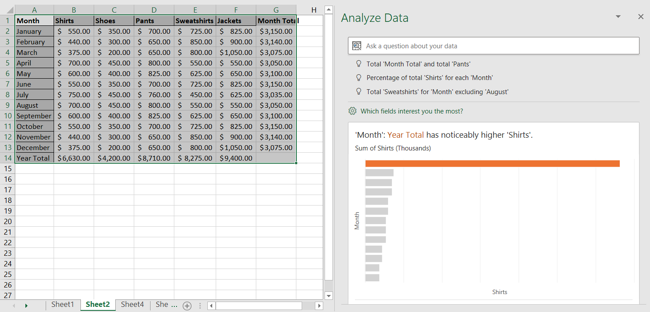
This will open a nifty task pane on the right side with visuals, options, and other ways to analyze your data.
Analyze Data Options
Now, you’re one step ahead toward some valuable data analysis in Excel. Here are the options that you have using the tool.
Ask a Question
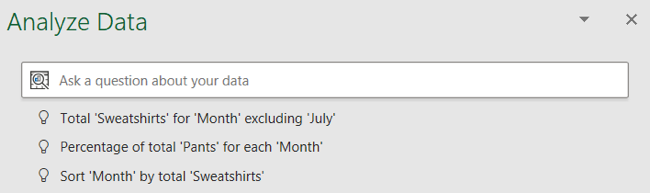
Starting from the top of the Analyze Data task pane, you can begin with a natural language question, and you’ll see a couple of ideas right below the question box that can help.
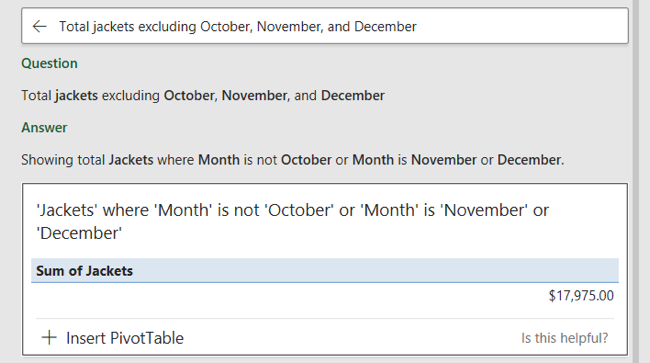
Depending on the type of data that you’re using, you can type in things like, “How many shirts sales in January,” “What are shoes and pants total sales,” or “Total jackets excluding December.”
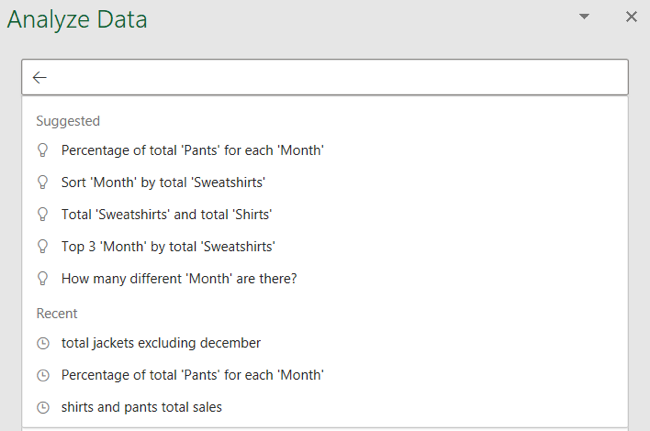
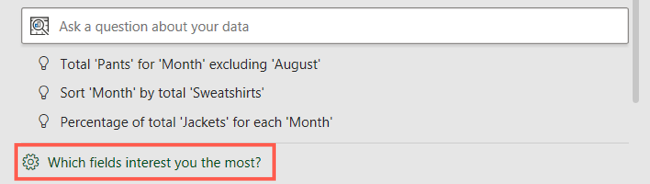
Along with the ideas at the top, you can also see suggestions by clicking in the question box. This provides a drop-down list of recommended questions. You’ll also see any recent questions that you’ve asked to quickly revisit them if you’d like.
Answers to your questions or results from suggestions you pick display directly beneath.
Select Your Fields of Interest
Below the question area of the task pane is a link for Which Fields Interest You the Most? If you want to narrow down the data that you’re analyzing, you can do so by clicking this.
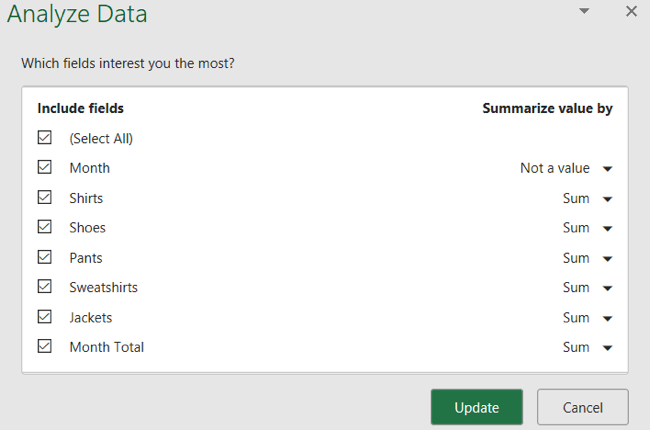
You’ll then see the fields for your data and their summarized values. Use the check boxes on the left side to select the fields that you want to analyze. The values on the right are populated automatically in categories for Not a Value, Sum, and Average. If you need to adjust one, you can.
Click “Update” when you finish.
You can then review the results of the data analysis for the fields that you selected.
View the Analysis Results
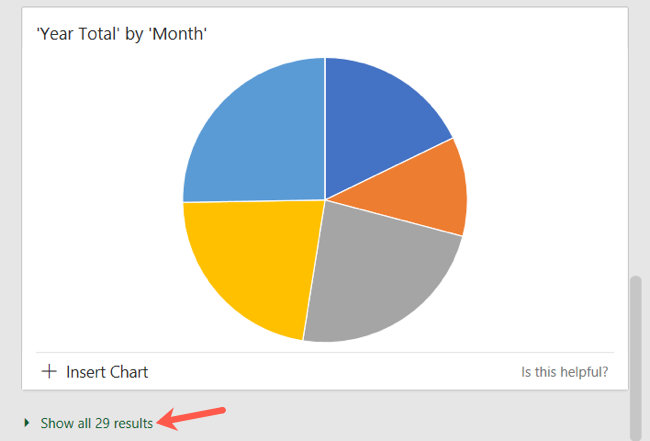
The remainder of the Analyze Data task pane is filled with various types of visuals based on your specific data. You might see things like a bar chart where certain fields stand out, a table comparing two items, a pie chart with totals, or a column chart showing the frequency of an item.
You’ll only see a few visuals, but if you scroll to the bottom of the sidebar, you should see how many additional results there are. Click “Show All X Results” to view the remaining visuals.
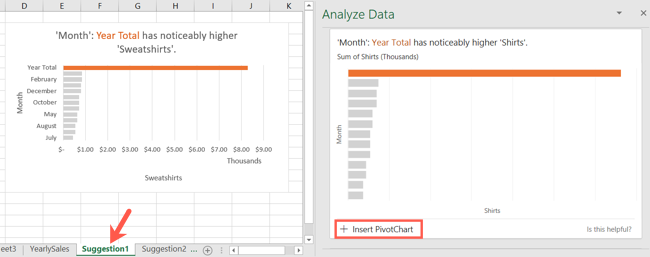
Aside from giving you quick and easy ways to analyze your data, these results also give you tools. On the bottom left of one, you can click to insert a PivotTable , PivotChart, or Chart.
Related: How to Use Pivot Tables to Analyze Excel Data
This will pop that item right onto a copy of your spreadsheet in a new tab. These sheets will be named Suggestion 1, Suggestion 2, and so on.
So not only does this save you from having to manually create these items yourself, but it also doesn’t disturb your current sheet or the data in it.
Making Changes to Your Data or Sheet
If you make changes to your spreadsheet with Analyze Data open, the task pane won’t update automatically. Simply close the task pane using the X on the top right and then click “Analyze Data” on the ribbon in the Home tab to reopen it.
After you close and reopen the Analyze Data task pane, any recent questions you’ve asked will not display in the drop-down list.
Get a jumpstart from Microsoft when analyzing your data in Excel. This feature not only shows you quick summaries and patterns, but also helps you create tools to use in your spreadsheet.
Related: How to Use Excel’s “Quick Analysis” to Visualize Data
Also read:
- [New] 2024 Approved From Chat Room to Screen Step-by-Step Google Meet YouTube Streams
- [Updated] 2024 Approved Abridged Blueprint for Starting Virtual Conversations Zoom Edition
- [Updated] 2024 Approved Luts Application in Movie Post-Production Coloring
- 「プロモーションビデオ作成後にMP4ファイルが正常に再生されない場合の解決法」
- 2024年版 PS5 ビデオ再生問題解決法:ステップバイステップガイド
- 高度WAV編集ガイド:効果的にトリミング・組み合わせ・ボリューム調整法
- In 2024, Can Life360 Track Or See Text Messages? What Can You Do with Life360 On Vivo Y100 5G? | Dr.fone
- Top 100 Unbeatable Walmart Holiday Bargains: Your Guide to Savings
- Ultimate Guide to the Premier Acoustic Gear , Assessed & Compared | PCMag
- YouTube ミュージックダウンロードガイド - 曲を正しく記録するための効果的な手法
- ぜひ体験!OBS Studioで美しくキレイに高精細化されたゲーム動画の作成法
- Title: Unlock Insights with Microsoft Excel: Understanding and Utilizing the 'Analyze Data' Functionality
- Author: David
- Created at : 2025-01-01 20:02:04
- Updated at : 2025-01-06 17:23:26
- Link: https://win11.techidaily.com/unlock-insights-with-microsoft-excel-understanding-and-utilizing-the-analyze-data-functionality/
- License: This work is licensed under CC BY-NC-SA 4.0.