The Overlooked Duo of Windows Monitoring Metrics

The Overlooked Duo of Windows Monitoring Metrics
Windows comes packed with many different tools for troubleshooting purposes, so there’s a good chance that you missed using most of them. Two such underutilized tools are the Reliability Monitor and the Performance Monitor.
Both of these tools can help you identify system instability and performance-related issues with your computer. Want to know more about them? We’ve explained the key differences and use cases of the Reliability Monitor and the Performance Monitor below.
What Are the Reliability and Performance Monitors on Windows?
The Reliability Monitor and Performance Monitor are built-in Windows tools that help you find problems with your system’s performance or reliability.
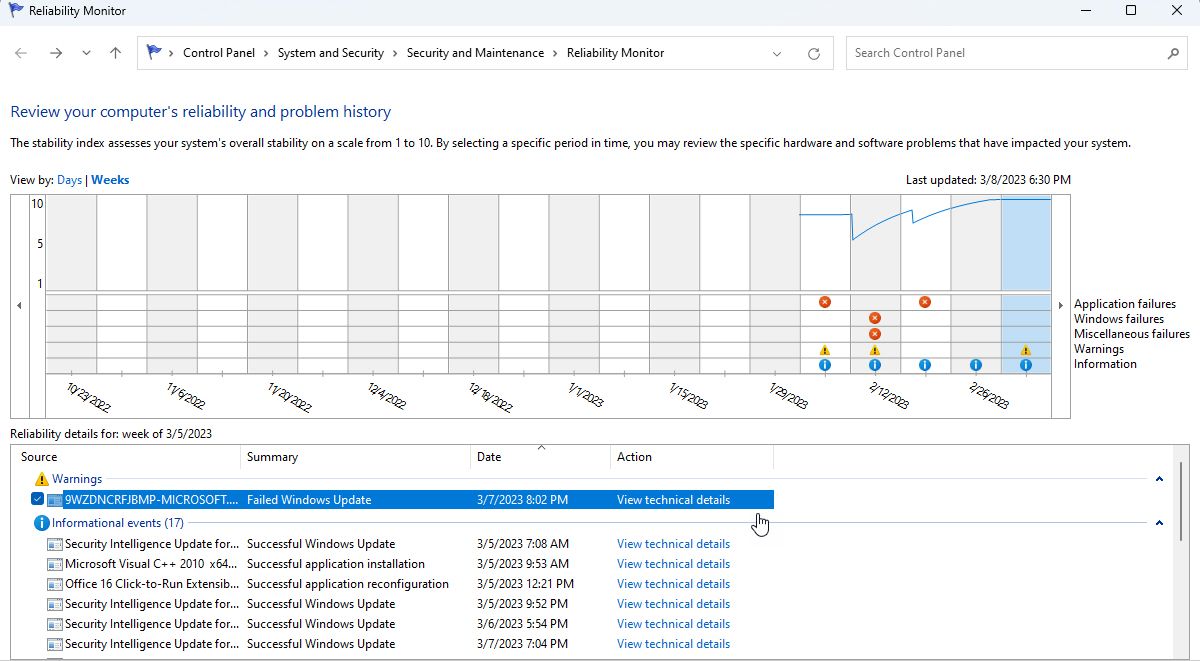
The Reliability Monitor shows a graphical view of your computer’s stability over time. It even displays a timeline of system events. In simple words, it shows you the date and other information of events like application crashes, hardware failures, and system errors.
Suppose you are experiencing sudden system freezes and want to identify the root cause; you can get help using the Reliability Monitor. You can view the exact reason behind the system freeze inside the reliability history.
On the other hand, the Performance Monitor is another in-built Windows diagnostics tool that provides detailed information about your computer’s performance. You can view real-time performance metrics like CPU usage, disk, and memory usage through the app.
The Reliability Monitor’s Key Features
Now that you know the uses of both tools, let’s find out some of the significant differences between them and when to use each one on Windows.
- Graphical representation: It presents a graphical overview of system stability over time, highlighting critical events and warnings. Additionally, it allows you to view detailed information about each event.

- Problem Reports: This feature enables you to report any problems or errors you encounter to the Microsoft developers for improvement.
- System Stability Index: It measures the overall stability of your system over time. The index ranges from 1-10, where 1 represents a highly unstable system and 10 represents a highly stable system. The Stability Index considers the frequency and severity of system crashes, errors, and downtime.
Performance Monitor Key Features
As highlighted above, the Performance Monitor tool is not for non-techy geeks, as it shows in-depth technical details. However, if you’re a system administrator or a technician interested in monitoring a computer’s performance, then it’s a valuable tool for you.
Here are some of the noticeable features of the Performance Monitor:
- Real-time performance metrics: You can monitor the performance of your system in real time. You can also freely customize the metrics/data to focus on specific areas of interest using Data Collector Sets.
- Create Data Collector Sets: Here’s the kicker: You can create custom reports from a pre-defined template or choose one manually. By creating your own Data Collector Sets, you can tailor the monitoring to your specific needs.
- Resource Monitor: Resource Monitor is a part of the Performance Monitor. You can track the consumption of your system resources in real time by using it.

So, what’s the bottom line of using the Performance Monitor? Though it is not for everyone, it still caters to the needs of some who love playing with technical statistics and numerical data.
The Advanced Functions of the Reliability and Performance Monitors
The Reliability and Performance Monitors have advanced functions allowing you to customize and filter data.
The Reliability Monitor allows you to filter events by application, source, and event type, making it easier to identify specific types of system events. But is that useful for you?
Yes, indeed, filtering helps in case you want to find out the reason for a random Blue Screen of Death error or maybe an unfortunate system crash. The best part is that Reliability Monitor will sometimes generate a minidump (logs) to help you troubleshoot the cause.

On the other side, the Performance Monitor also helps you with filtering, but it’s far superior and advanced.
The best part is, you can also configure alerts in the Performance Monitor. By doing so, you can record the moments when specific performance metrics exceed certain thresholds. For example, you can set an alert to notify you when CPU usage exceeds 90% for more than 15 minutes. This ultimately helps you to take proactive measures to prevent system downtime.
The Different Use Cases for the Reliability and Performance Monitors
The main goal of the Reliability Monitor is to find potential problems in your system before they cause major issues.
You can use it to troubleshoot software installations, monitor system updates, and resolve Blue Screen of Death errors. But that’s not all! As Windows updates sometimes fail for no reason, Reliability Monitor may come to the rescue and highlight any issues during the update process.

The Performance Monitor can help you monitor how your system is running and find problems related to its performance. You can even use it to speed up Windows by analyzing the performance trends of your computer.
How to Use the Reliability and Performance Monitor
Using both tools is relatively easy on Windows. While Reliability Monitor may look more straightforward, it provides a quick overview of system stability, whereas Performance Monitor offers more detailed information, making it a better option for advanced users.
Here’s how to use Reliability Monitor and Performance Monitor on Windows:
- Open the Windows Search menu by clicking theWindows icon on the taskbar or pressingWin + Q for quick access.
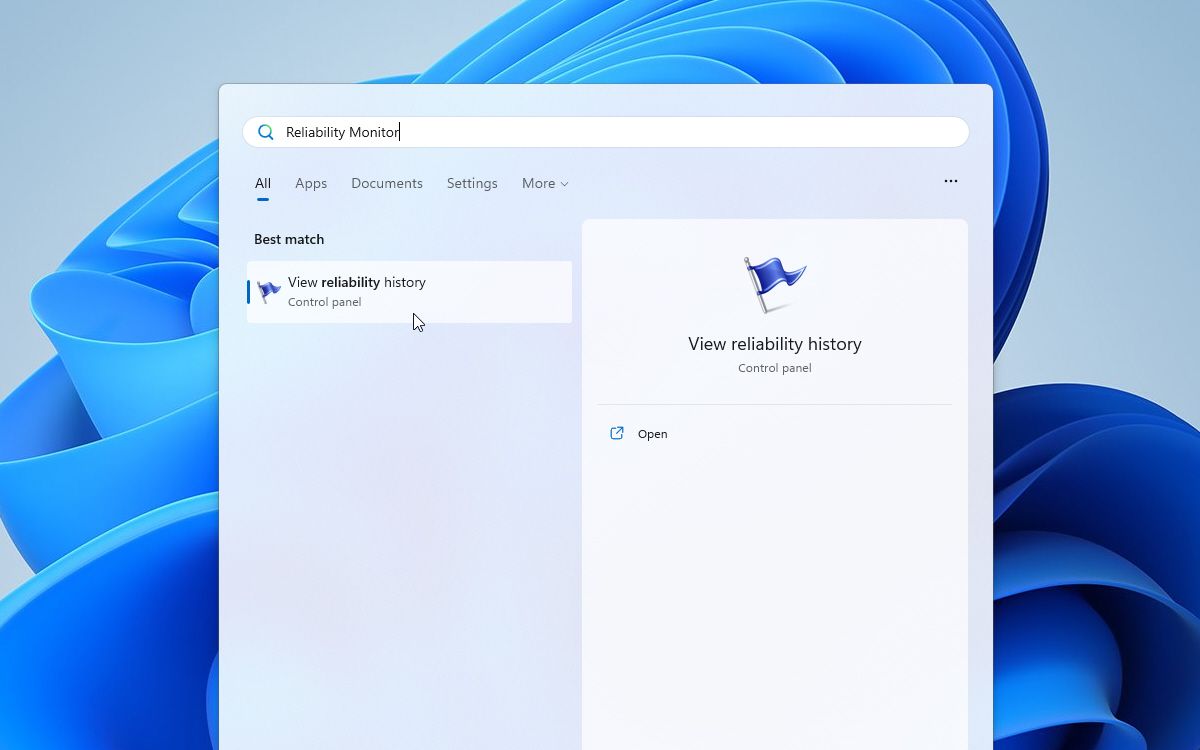
- TypeReliability Monitor in the search bar. ClickView reliability history to open Reliability Monitor on Windows. Please wait a few seconds to let it generate the required results.


- Click the date for which you want to view the results. UnderSource , clickView technical details next to your desired event to view its complete description.

- If you’re an advanced user, typePerformance Monitor in the search bar to open it.
- You can click the green**(+)** icon on the Performance Monitor window to add a counter (a performance metric) and let the tool measure it for you.

Besides these tools, Windows is bloated with many other useful utilities to improve your experience. If you are interested in such things, check out our guide on some useful Windows administrative tools .
Say Goodbye to Unreliable Windows Systems
To summarize everything above, you can use the Reliability Monitor for identifying the causes of any system stability issues. On the other hand, Performance Monitor can assist you in the real-time monitoring of your system performance.
Undoubtedly, both tools are useful in times of need despite having separate target audiences. You can save time and system resources by quickly identifying and resolving Windows issues by using them together wisely.
- Title: The Overlooked Duo of Windows Monitoring Metrics
- Author: David
- Created at : 2024-08-16 00:23:41
- Updated at : 2024-08-17 00:23:41
- Link: https://win11.techidaily.com/the-overlooked-duo-of-windows-monitoring-metrics/
- License: This work is licensed under CC BY-NC-SA 4.0.


