
Tackling Overheating PCs with Windows Resource Monitor Insights

Tackling Overheating PCs with Windows Resource Monitor Insights
The Resource Monitor application offers a detailed graphical user interface to help you monitor the behavior of your system resources. The app’s interface may seem confusing at first, but once you get to know it better, it’ll become an indispensable tool when troubleshooting high CPU usage issues on Windows.
So, let’s take a look at some use cases of the Resource Monitor application on Windows.
Disclaimer: This post includes affiliate links
If you click on a link and make a purchase, I may receive a commission at no extra cost to you.
What Does the Resource Monitor Utility on Windows do?
You may have experienced the headache of a Windows PC slowing to a crawl due to high CPU usage. Generally, CPU usage increases due to either background processes or heavy applications currently running on your system. The good news is that you can easily pinpoint which apps or services are consuming your CPU cycles. This is where Windows’ built-in Resource Monitor tool comes in handy.
Resource Monitor provides you with real-time information on hardware utilization by all processes and services. With its graphical charts and numerical data, you can quickly diagnose high CPU issues and take action to resolve them.
What Can You Monitor Using Resource Monitor?
The Resource Monitor dashboard provides an overview of current system-wide resource utilization across four key areas:
- CPU usage: This section graphs overall CPU usage over time and displays a list of processes with their CPU impact. It provides details like PID, status, thread count, and CPU cycles consumed.
- Memory usage: You can view details about your system’s memory like the total physical memory and the processes consuming memory from here.
- Disk activity: This tab is for monitoring current disk operations broken down by reads/writes. It includes a histogram that charts the response time distribution.
- Network activity: Here, you can track sent/received bytes by process along with real-time network utilization graphs.
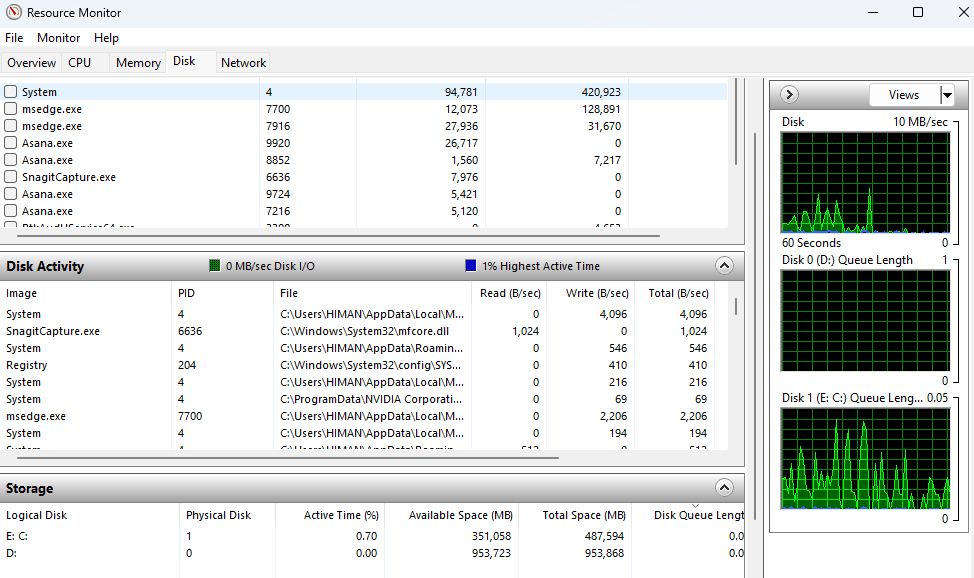
Combined, these categories give you full visibility into all hardware resource consumption by every process and service. If you’re not a technical geek, you can still get some useful information from there for troubleshooting.
1. How to Troubleshoot High CPU Usage With the Resource Monitor
In the event of an unresponsive, sluggish computer, the first step is to open the Resource Monitor and check the CPU tab.
Here, you’ll find two types of sections - the overall CPU usage graph and the per-process CPU usage list. The usage graph is pretty easy to understand, but the main use is of the processes list with all the details.
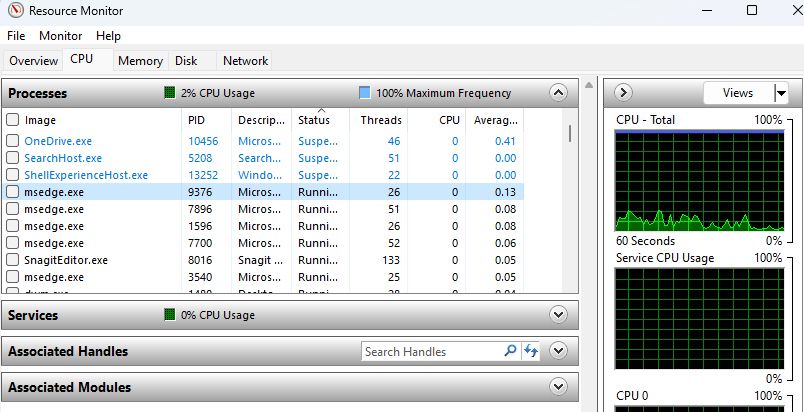
The CPU history graphs at the top show overall CPU usage over time, broken down by category. If you see a blue-colored spike, it indicates that there was a sudden increase in CPU usage. This could be due to a specific process or application consuming a considerable portion of your overall CPU resources.
On your left side, click the CPU column header to sort processes in descending order of current CPU usage. Note that the numbers are just the percentage of the process consuming the CPU. So, a higher number means it’s consuming more CPU power than others.
If your system is slow, and you’re unable to use Resource Monitor, check how to fix Resource Monitor on Windows for help.
2. How to Diagnose a Slow Internet Connection With the Resource Monitor
Resource Monitor also makes it easy to determine if network connectivity issues like slow internet or high latency are being caused by a bandwidth-hogging application.
Simply click the Total (B/sec) column header to sort processes by network usage rate and identify any heavy bandwidth consumers. Programs such as your active web browser or any game you’re currently running will surely consume more data. But, besides such programs, if any of the processes is displaying a high number, it’s a warning sign for you.
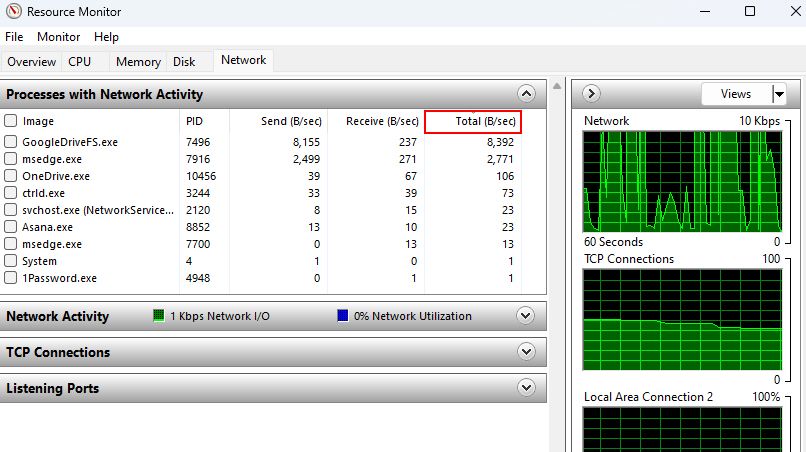
With network-related metrics isolated per process, Resource Monitor helps simplify diagnosing connectivity slowdowns. After that, you can also read how to fix a slow internet connection on Windows to learn more useful ways.
3. How to Check Disk Activity With the Resource Monitor
Sluggish system performance is not always the CPU’s fault. Sometimes, poor disk activity can also be a major drag if processes are queuing excessive read/write operations.
This is where Resource Monitor’s Disk tab provides valuable insight. The disk usage graphs on the right side show you real-time reads and writes.
But most importantly, the process disk activity list reveals which specific apps or services are doing all that writing and reading. Click the Total (B/sec) column to sort by disk usage rate and see the top troubling processes. The rest of the columns show separate read and write operations for each process.
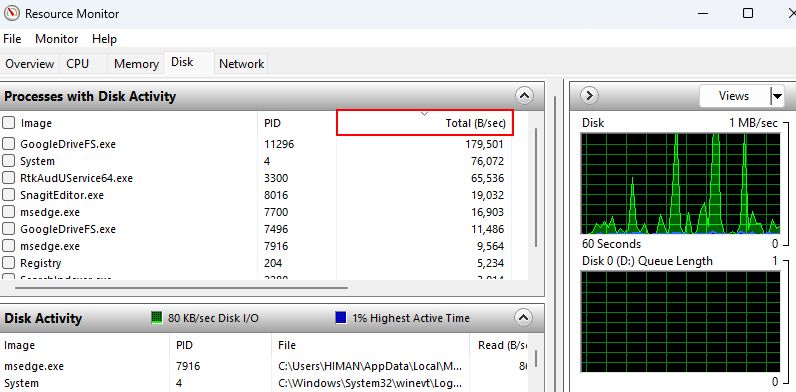
If you’re unable to decide which process to stop, please check out how to fix high disk usage to improve your disk’s performance.
4. How to Find Memory-Consuming Processes With the Resource Monitor
Available memory is as important to performance as CPU and disk resources. A memory leak can bring even the beefiest system to its knees. The best part is that Resource Monitor provides you with enough details to troubleshoot your system’s memory .
In Resource Monitor’s Memory tab, there are multiple metrics to monitor. The main ones are Free memory, In Use memory, and Hard Faults/sec.
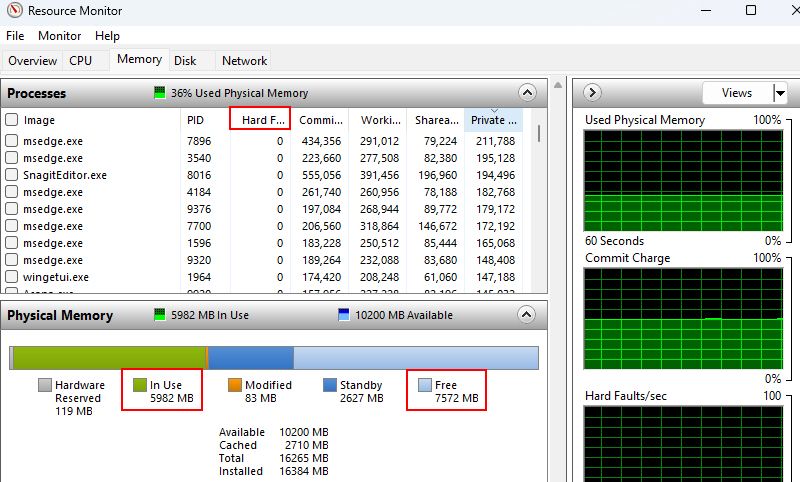
The Free and In Use memory count display the amount of memory currently unused and the amount used by the system, respectively. If you see the In Use memory count rising too high, make sure to close some unnecessary running programs.
On the other side, if the values of Hard Faults/sec are higher (click on its name to sort), it indicates that your system is experiencing memory pressure. In simple terms, a higher value shows that your system is relying on virtual memory to compensate for the lack of physical RAM.
To see which processes are consuming the most memory, click the Working Set (Memory) column header to sort by current memory usage. Then, you can identify any outliers hogging available RAM.
With the available memory information and our below-given tips, you can troubleshoot memory bottlenecks easily:
- If a process shows high memory usage, try closing that specific application (via the Task Manager) and then restart your PC.
- If possible, add more RAM if available memory maxes out regularly. The applications you use on your PC may require more RAM than currently installed.
- Check out how to disable startup programs on Windows and try disabling those that you won’t require immediately when you turn on your PC.
Keep an Eye Out for CPU-Consuming Processes With the Resource Monitor
By understanding the basics of using Resource Monitor, you can move from simply staring blankly at a slow, unresponsive computer to pinpointing exactly which processes or services are hogging your system resources.
We highly recommend going through each tab and using the sorting capabilities to check the offenders by CPU, network, disk, and memory usage. Once you identify the resource hogs, you can stop the problematic processes/tasks.
So, let’s take a look at some use cases of the Resource Monitor application on Windows.
Also read:
- [Updated] In 2024, Noise-Free Videography Utilizing Free Tools or Purchasing
- [Updated] Understanding and Executing Photo Gender Modification Online for 2024
- Boost Your Game Presence A Comprehensible Guide to FreeGame Hashtags
- Definitive Tips for Preventing & Repairing Phoenix Point Game Crashes
- In 2024, Prime Oculus Rift Games Captivating Players Worldwide
- Overcoming System's Refusal to Run Latest Windows Version
- Perfectly Pairing Words and Images: Emoji 15 in Win11
- Solving 'PrintManagement' MSC Error: A Step-by-Step Guide
- Tech Tip: Quiet Down Windows' Hardware Keys
- The Roadmap to Making Money with Personal Videos
- Top 3 Sites to Find Free ZTE Unlock Codes to Unlock Your ZTE Phone
- Troubleshooting Steps: Solving the Mystery of Missing Wi-Fi on HP Devices
- Unlocking Secrets to Recover Lost Gpedit.msc Access
- Unseen Windows Reawakened: Swift Tips for Win10 & 11 Users
- Windows Control Panel Hacks: USB Access Management
- Title: Tackling Overheating PCs with Windows Resource Monitor Insights
- Author: David
- Created at : 2024-10-23 16:41:17
- Updated at : 2024-10-26 20:58:01
- Link: https://win11.techidaily.com/tackling-overheating-pcs-with-windows-resource-monitor-insights/
- License: This work is licensed under CC BY-NC-SA 4.0.