Step-by-Step Tutorial on Determining Moving Averages with Microsoft Excel Tools
Step-by-Step Tutorial on Determining Moving Averages with Microsoft Excel Tools
Quick Links
You may think of a moving average for forecasting stocks or investments . But you can also use it to see trends for inventory, sales, or similar data. Without equations or functions, you can calculate a moving average easily in Excel.
Related: How to Use the Built-In Stocks Feature in Microsoft Excel
Add the Data Analysis Tool in Excel
While you can perform calculations and create a line graph to display your moving average in Excel, there’s an easier way.
Microsoft offers a free Analysis ToolPak that you can add to Excel. The tool lets you develop statistical or engineering analyses with a variety of functions. One such option is a moving average.
To see if you already have the Analysis ToolPak, go to the Data tab and look for the Data Analysis button in the Analysis section of the ribbon.
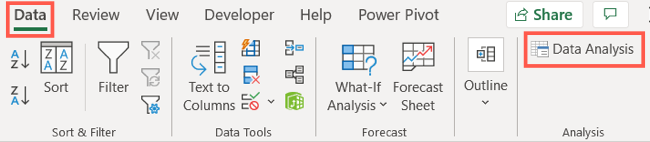
If you have the button, you’re good to go and can move on to calculating a moving average below. If not, here’s you can add it quickly.
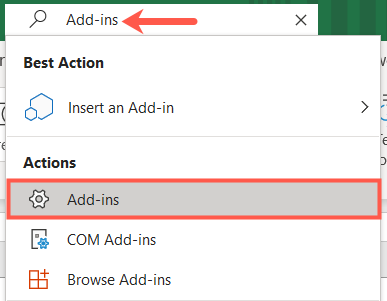
Go to the Search box at the top of Excel and enter “Add-ins.” When you see Add-ins in the list, select it.
Alternatively, click File > Options and select “Add-ins” on the left. At the bottom of the window, next to Manage, pick “Excel Add-ins” and click “Go.”
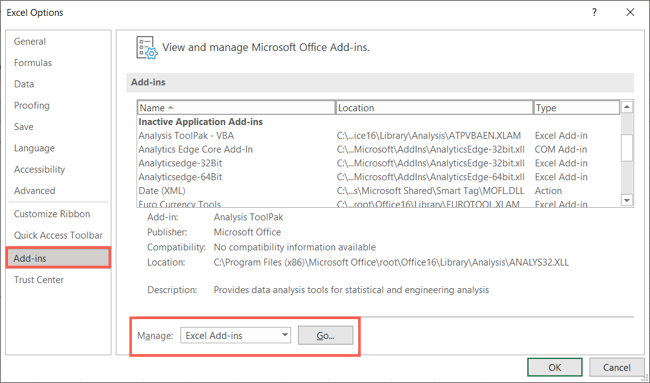
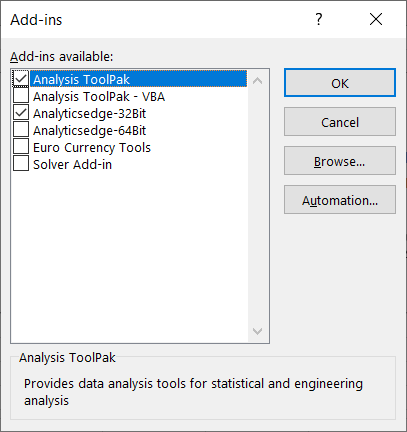
After the Add-ins window displays, check the box next to Analysis ToolPak and click “OK.”
Now when you head to the Data tab, you should see the Data Analysis button in the ribbon.
Related: How to Get Microsoft Excel to Calculate Uncertainty
Calculate a Moving Average
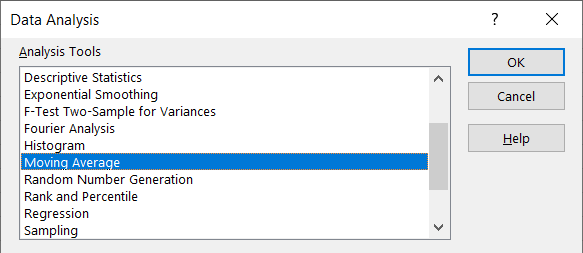
When you’re ready to calculate the moving average, click the Data Analysis button on the Data tab. Select “Moving Average” from the list and click “OK.”
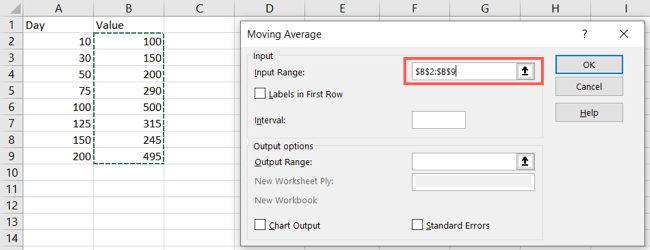
At the top of the Moving Average window, enter the Input Range into the corresponding box. You can also click inside the box and then drag through your data range. Optionally, you can check the box for “Labels in First Row” and include an Interval.
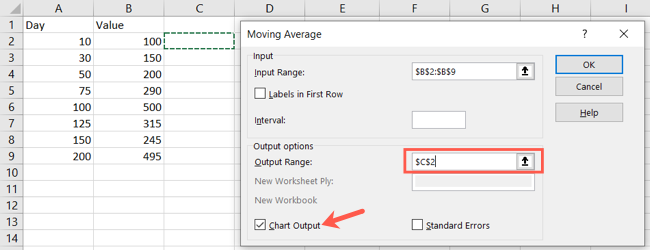
Next, enter the Output Range by entering a cell reference or clicking inside the box and selecting a cell on your sheet. Optionally, you can check the box for Standard Errors. And to create a graph of the moving average as well as receive the results, check the box for Chart Output.
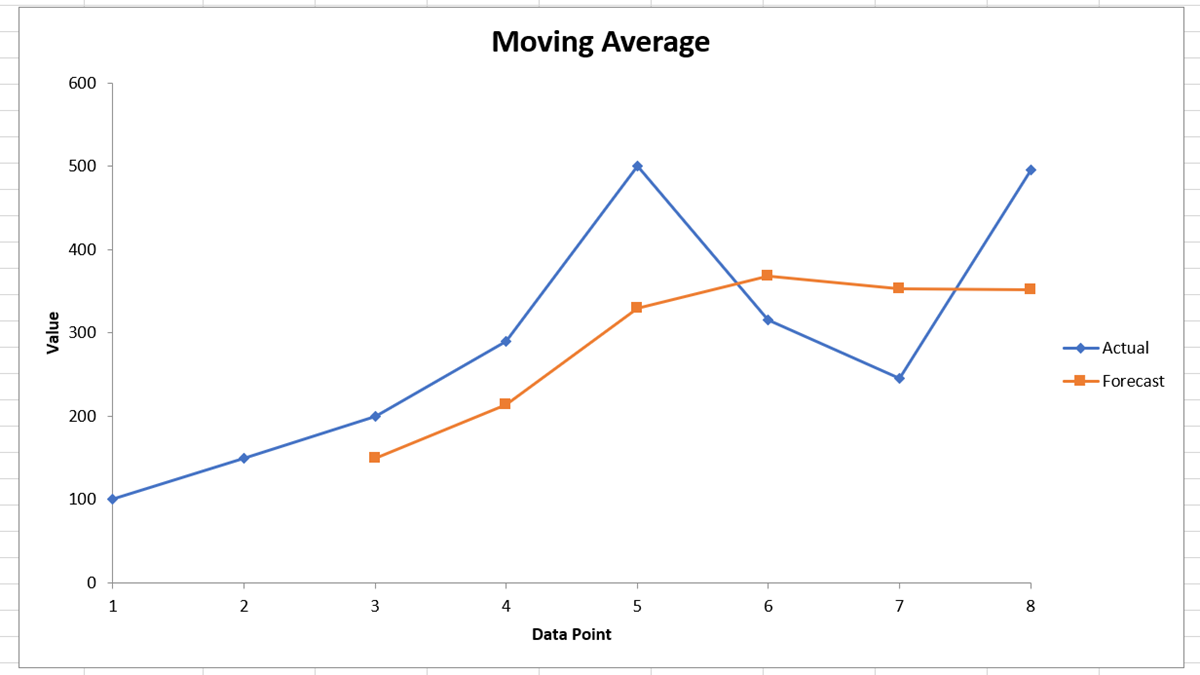
When you finish setting up the moving average click “OK” and you’ll see the output. You have the values beginning in the cell you selected for the output. If you selected the Chart Output, you’ll have a handy line graph displaying the data as well.
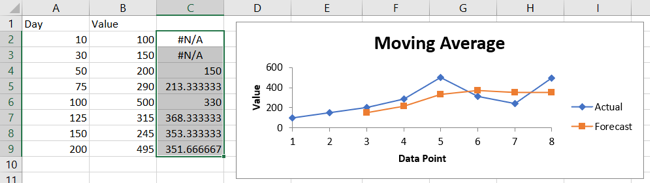
You can customize the Moving Average graph like any other chart you create in Excel . Select the graph and use the Chart Design tab to adjust the layout, colors, legend, and more.
Be sure to check out the other options available with the Analysis ToolPak. You can do things like create a histogram , find a correlation, or use the random number generator.
Also read:
- [Updated] 2024 Approved Mastering Instagram The Art of Rewinding Videos
- A Step-by-Step Tutorial on iCloud Collaboration Features in Apple's Pages Document App
- Effortlessly Convert SHN Files with Our Leading Audio Converter - Now Supports MP3, FLAC & WAV Formats!
- Free Trial of Factory Pro MP4 Video Converter with Secure Payment Option
- Free Video Editing Tips: How to Insert Texts Without Any Watermark Issues
- Guide to Changing Audio Format From M4A to WAV in Windows 10
- How to Import and Watch AVI Videos on iTunes – Conversion Guide
- How to Safely Download Movies From YesMovies: A Step-by-Step Guide
- In 2024, 8 Safe and Effective Methods to Unlock Your iPhone 14 Pro Max Without a Passcode | Dr.fone
- Lösungsweg Für Fehlende Partitionsfestplatten: Warum PC Nicht Zurückgesetzt Werden Kann Und Wie Es Gelöst Wird
- RAM in Formato WMA: Trasformare Online E Gratuito - La Guida Completa Al Metodo Movavi
- Step-By-Step Guide on Stopping YouTube's Automatic Previews
- Step-by-Step Guide: Downloading Race Broadcasts From PC & Mac Systems
- Unlocking Gemini Live: Your Ultimate Guide to Joining & Discover Its Unique Benefits | CyberGuardian
- Title: Step-by-Step Tutorial on Determining Moving Averages with Microsoft Excel Tools
- Author: David
- Created at : 2025-01-04 20:24:11
- Updated at : 2025-01-06 17:49:26
- Link: https://win11.techidaily.com/step-by-step-tutorial-on-determining-moving-averages-with-microsoft-excel-tools/
- License: This work is licensed under CC BY-NC-SA 4.0.