
Mastering Excel's In-App Stock Tracking: A Comprehensive Guide

Mastering Excel’s In-App Stock Tracking: A Comprehensive Guide
Quick Links
- Add Stock Data to Your Excel Sheet
- View the Data Type Card
- Refresh the Stocks Data
- Don’t See the Stocks Feature?
If you need stock market data for your spreadsheet, you can save time and get up-to-date information with the built-in Stocks data type in Microsoft Excel. Here’s how to populate your sheet with details like ticker symbols, market caps, previous close, and more.
Add Stock Data to Your Excel Sheet
To use the Stocks data type in Microsoft Excel, you only need an internet connection and a bit of your own data to start.
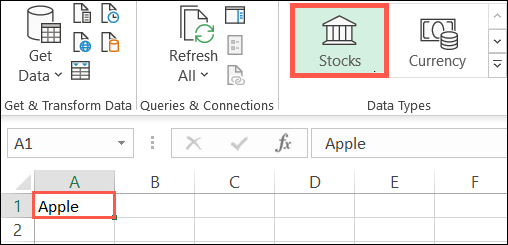
Open your spreadsheet and type a piece of information, like a company name or stock symbol. With the cell still selected, open the “Data” tab, and then click “Stocks” in the “Data Types” section of the ribbon.
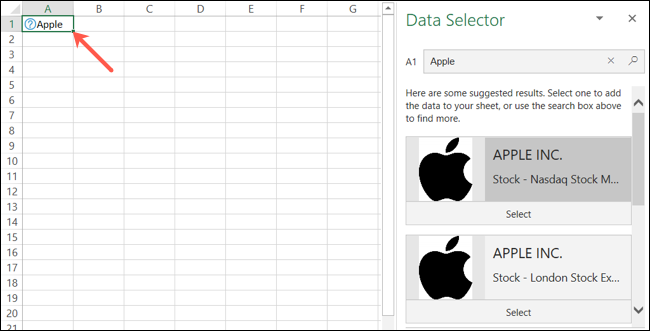
After a few seconds (depending on your internet connection), you might see the “Data Selector” sidebar open on the right. This happens when your item can’t be found or more than one stock with that name is available.
Click “Select” under any of the available options in the sidebar.
If you click away from the cell that contains your initial data, just select it again, and then click the small Insert Data icon that appears next to it. A long, scrollable list containing all the stock market details you could possibly need will appear.
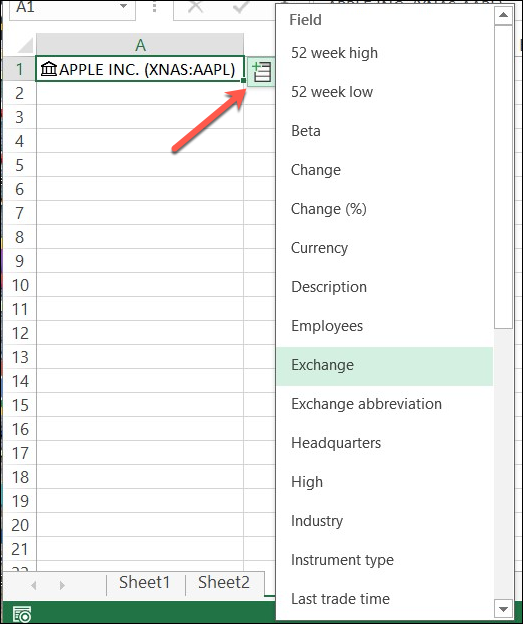
Choose the information you want to include and it will pop into the cell at the right. You can continue adding details for the stock in this same way. Any additional details you choose will populate in the subsequent cells to the right.
You can also add column headers to identify the data you include. At any time, though, you can just click the cell containing an item to see what it is in the Formula Bar.

View the Data Type Card
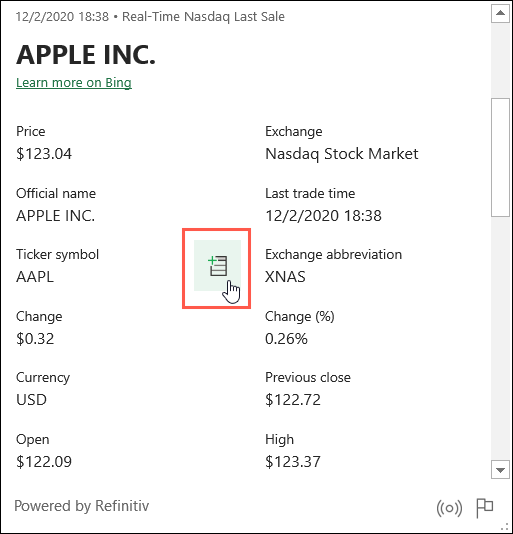
The scrollable list of details for a stock is helpful, but you can also view this same data in a card format. Just right-click the cell containing the company or stock you first typed, and then select “Show Data Type Card” from the menu that appears.

You can then see those same details in an easy-to-read snapshot. You can also drag the bottom-right corner to enlarge the card if necessary. To add move information from the card to your sheet, just hover your cursor over that piece of data, and then click the Extract to Grid icon.
Refresh the Stocks Data
Like the Geography data type in Microsoft Excel , the Stocks data type retrieves information from an online source. This means you can update it without opening a web browser.
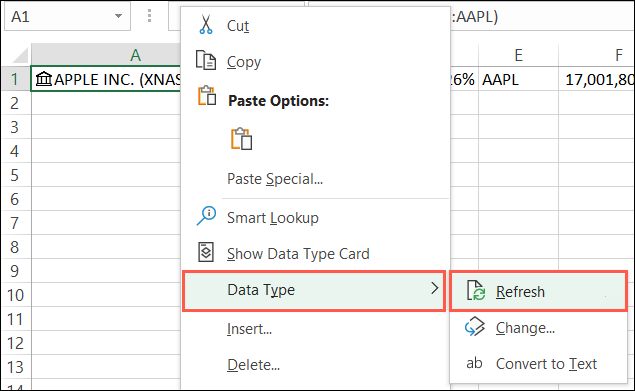
To do so, just right-click the cell that contains the company name or stock symbol, and then select Data Type > Refresh from the menu that appears.
Don’t See the Stocks Feature?
If you don’t see the Stocks data type in Microsoft Excel, make sure your system meets the following requirements:
- You’re using Excel for Microsoft 365: Microsoft might add this feature to additional versions in the future, but for now, you’ll have to use this one.
- You’ve updated to the latest version of Office: Microsoft is rolling out this feature gradually, so you might have to wait a bit. Just keep checking for new versions of Office .
- English is set as the editing language in Office: Excel’s data types are only available if you’ve done this. You can learn how to change it in Microsoft Word here , and this will also change it in Excel.
Related: How to Change the Language in Microsoft Word
Also read:
- [New] In 2024, Maximizing Impact Video Marketing on YouTube
- [New] Minimizing Movement Blur in Media
- [Updated] Breaking Boundaries Top 10 Novel Facebook Memes
- [Updated] Flawless Top Timelapse Capturer
- 10 Free Location Spoofers to Fake GPS Location on your Infinix Smart 8 HD | Dr.fone
- 2024年版 FLV ビデオプレイヤーの復活!Windows 10用トップテクニックリスト公開
- 成人向けビデオをキャプチャする効果的なテクニック
- 長持ちする方法:フリップビデオの最適な保存手段
- Get More Eyeballs Perfect Your YouTube Description Templates for Viewer Attraction for 2024
- Pushing Boundaries Top Virtual Reality Game Development Tools for 2024
- コーデック不足による動画再生障害を回避する方法
- ビデオの中にテキストサブタイトル追加手順集
- Title: Mastering Excel's In-App Stock Tracking: A Comprehensive Guide
- Author: David
- Created at : 2025-01-02 16:10:20
- Updated at : 2025-01-06 20:13:22
- Link: https://win11.techidaily.com/mastering-excels-in-app-stock-tracking-a-comprehensive-guide/
- License: This work is licensed under CC BY-NC-SA 4.0.